
Top 7 Things to Know Before Trading Bursa Malaysia Today - 3rd Nov 2026
Bursa Malaysia showed signs of institutional stabilization as retail momentum ignited sharp double-digit rallies across small caps like GIIB and NIHSIN. We analyze the KLCI's technical levels, key corporate meetings, and the latest broker targets to watch this week.
Top 7 Things You Should Know Before You Trade Today - Bursa/KLSE
1.Bursa Malaysia Market Summary and important levels trader should mark.
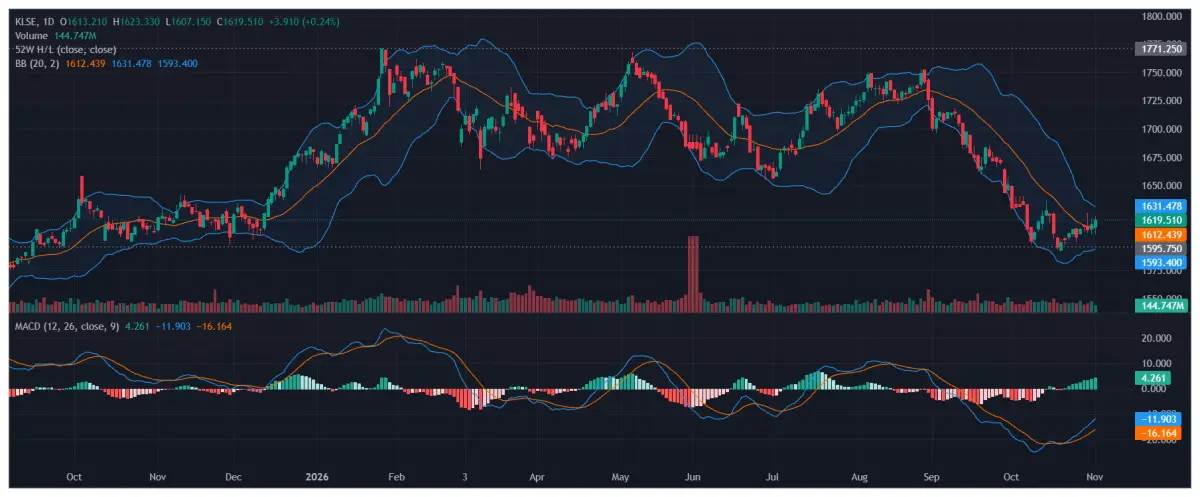
- Current Print & Price Action:
- Close: 1,619.51 (+3.91, +0.24%)
- Intraday Range: Low 1,607.15 to High 1,623.33 (Open: 1,613.21)
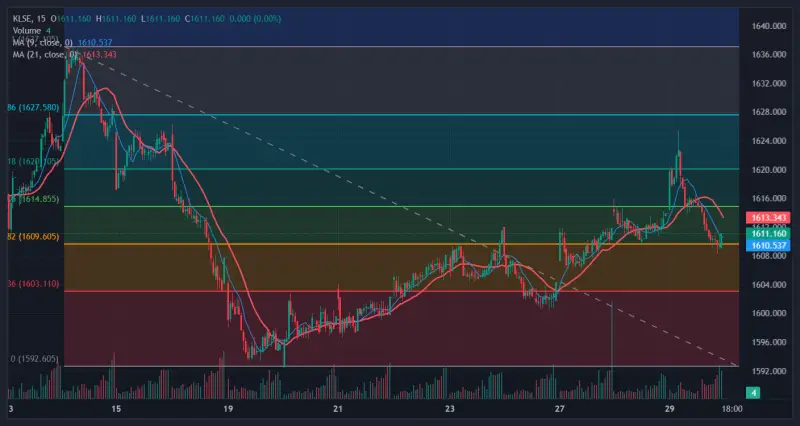
- Structure: After peaking near 1,770-1,771 in late August / early September, the index experienced an aggressive impulse decline toward the 1,595-1,600 psychological zone. The recent candles represent a consolidation base above the lower Bollinger Band, forming a short-term floor.
- Bollinger Bands $(20, 2)$ Dynamics:
- Upper Band: 1,631.48
- 20-day Basis (SMA): 1,612.44
- Lower Band: 1,593.40
- Interpretation: Price bounced off the lower band threshold (~1,593-1,595) and has reclaimed the middle band (20 SMA at 1,612.44). When price crosses back above the 20-day mean after riding the lower band, it technically signals a shift from trend selling to mean reversion/range expansion toward the upper band (~1,631.50).
- MACD $(12, 26, 9)$ Divergence & Momentum Shift:
- MACD Line: -11.903 | Signal Line: -16.164 | Histogram: +4.261
- Interpretation: Although both lines remain in negative territory (indicating the broader medium-term trend is still bearish), a bullish crossover occurred deep below the zero line. The histogram is printing expanding green bars, confirming positive short-term momentum and waning downside pressure.
2. Foreign Funds Flow Tracker
- Net Institutional Distribution:
- The cumulative foreign fund curve shows a steep, sustained distribution pattern beginning around May/June and intensifying through August-October.
- Foreign institutional outflows directly explain the heavy downward pressure seen on heavyweights and the index drawdown from 1,770 down to 1,600.
- Emerging Plateau / Inflow Tick:
- At the far right (late October into early November), the cumulative fund line flattened around 371,000-371,180 and registered a green uptick (+0.01% / +37.000).
- Theory: While it is too early to declare a complete institutional trend reversal, the relentless foreign net selling is stabilizing. This pause in aggressive liquidations removes the primary overhead selling pressure, providing the liquidity vacuum required for domestic players to lift index levels.
3. Key Theoretical Levels & Roadmap
| Level / Zone | Technical Significance |
| 1,631 - 1,635 | Immediate Resistance: Upper Bollinger Band test and prior horizontal breakdown shelf. |
| 1,650 | Major Structural Resistance: Previous pivot zone from the September selloff. |
| 1,612 | Immediate Support: 20-day SMA (Middle Bollinger Band) - must hold on pullbacks to sustain recovery structure. |
| 1,593 - 1,595 | Critical Floor: Lower Bollinger Band & 52-week swing base; breach invalidates the relief thesis. |
Summary Takeaway
The index is executing a standard oversold technical retracement. As long as the KLCI holds above the 20-day SMA (~1,612) and foreign selling remains paused/neutral, the path of least resistance points toward testing the upper band near 1,631-1,635. A failure to break 1,635, however, would keep the move categorized merely as a dead-cat bounce within a larger descending channel.
4.Stocks That Outperformed and top losers Yesterday
Bursa Malaysia: Best and Worst Performing Sectors
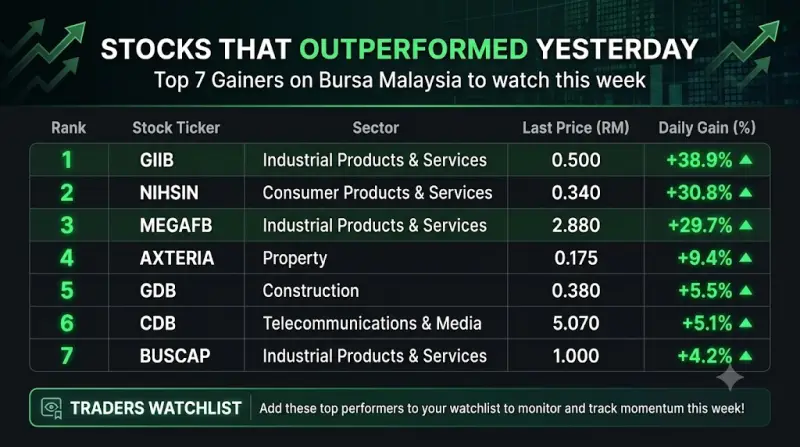
Watchlist & Momentum Tracking Advisory for Traders
⚠️ Trader's Note: Add These Top Performers to Your Watchlist for This Week's Momentum Tracking
- Immediate Watchlist Inclusion: Active intraday and swing traders should place these 7 outperforming counters-particularly the top volume-backed runners like GIIB, NIHSIN, and MEGAFB-at the top of their monitoring screens for the upcoming sessions.
- Track the Follow-Through Momentum: Large single-day spikes often spark secondary continuation moves, liquidity breakout retests, or gap-fill opportunities.
- Monitor Volume & Pullback Support: Rather than chasing prices at intraday highs, track whether these stocks consolidate healthily above their initial breakout levels or experience quick exhaustion pullbacks. Watch the order book depth and volume participation during the opening 30 to 45 minutes of each session to gauge institutional versus retail persistence.
- Strict Risk Discipline: Given the high percentage velocity seen in lower-priced counters, ensure tight trailing stops and clear entry/exit plans are defined before entering trades.
5. Stocks to Watch: Banks and Institutional Investors
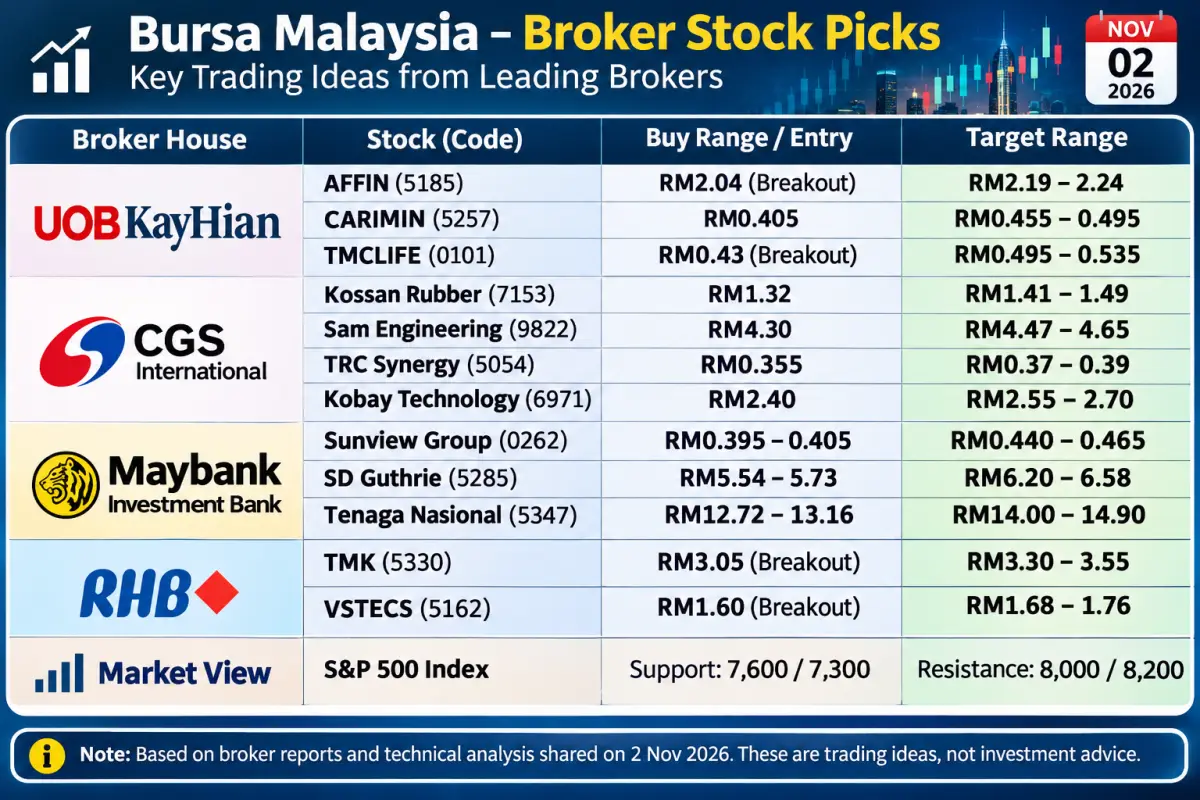
Investors should monitor stocks attracting attention from banks, institutional investors and brokerage research teams. Stocks with strong trading volume, positive technical signals and clear support levels may offer opportunities even when the broader market is weak.
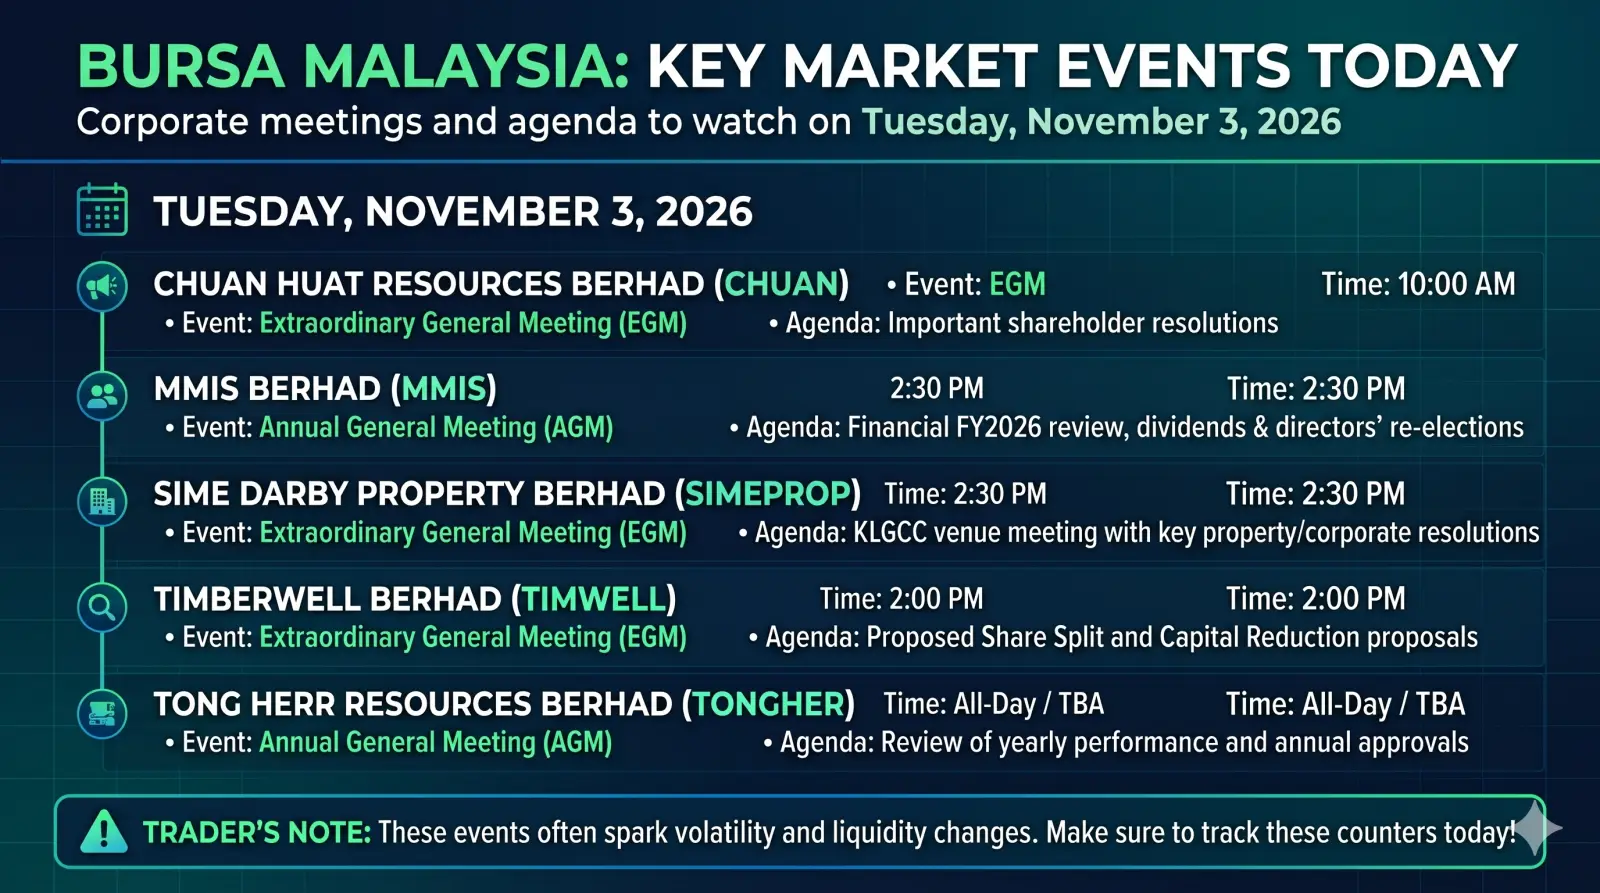
6.Bursa Malaysia: Corporate Events to Watch Today
Investors should confirm the dividend announcement and eligibility requirements with Bursa Malaysia before trading.
7.Global Markets Update
Nasdaq Momentum Analysis: How It Started & Ended
The Start: Bull Trap & Early Strength
-
Initial Push: The session opened in positive territory at 25,611.28 (above the previous close of 25,437.00) and peaked during early trade at a high of 25,799.46 (on the US 100 Cash CFD chart, testing near the 28,700+ liquidity pocket).
-
Reversal Signal: Shortly after that early attempt to break higher, price action failed to hold the highs. A clear SuperTrend Sell signal triggered around 28,600 on the 5-minute chart, breaking below the dynamic 20/50 EMA band.
The Middle: Sustained Markdown Phase
-
Loss of Short-Term Moving Averages: Once the 28,500 psychological shelf gave way, the session transitioned into a textbook cascade selloff.
-
Lack of Pullback Participation: Every minor relief bounce was systematically sold into, with candles hugging the declining red SuperTrend band and EMAs sloping sharply downward.
The Close: Weak Settlement at the Session Lows
-
Closing Numbers: The Nasdaq CFD index settled near its dead-low of 25,165.80, down -271.20 points (-1.07%), with the intraday low printed at 25,157.81. On the US 100 Cash CFD, the slide pressed below 28,000 to close around 27,977.30 (-1.41%).
-
Momentum Verdict: A closing-at-the-lows print indicates aggressive institutional distribution right into the final hour without any late short-covering attempt.
How the Hang Seng Index (HSI) May React Tomorrow
The Hang Seng Index closed yesterday at 23,372.23 (+0.33%), while the Hong Kong 50 futures / 5-min index closed higher near 23,524.80 after an evening spike toward 23,600.
Because the US tech selloff intensified late into the night, HSI faces strong cross-currents heading into the morning cash open.
Key Transmission Channels
-
Negative Tech Sentiment Spillover:
-
Heavyweight Chinese tech names that heavily weight the Hang Seng Tech Index (Tencent, Alibaba, Meituan, Baidu) tend to track US tech sentiment closely. The sharp dump in Nasdaq futures from 28,700 to below 28,000 will likely exert immediate opening drag on these components.
-
-
Late-Evening Gap Risk:
-
On the 5-minute Hong Kong 50 chart, an initial rally to 23,600 met resistance, triggered a SuperTrend Sell signal, and drifted back down to test the 23,502 - 23,520 support zone (green SuperTrend line).
-
Given the Nasdaq's weak finish at session lows, HSI futures are poised to gap down or open under pressure, testing whether domestic mainland liquidity steps in to defend the morning dip.
-
-
Key Hang Seng (HK50) Trading Levels to Monitor
| Level / Zone | Technical Relevance |
| 23,600 - 23,620 |
Primary Resistance: The intraday peak and double-top zone where yesterday's evening push failed. |
| 23,500 - 23,520 |
Immediate Pivot: SuperTrend line (23,502.2) and short-term EMA support. A breakdown here confirms morning follow-through selling. |
| 23,370 - 23,350 |
Gap Fill / Key Cash Support: The official cash close area from yesterday and the base of the previous breakout rally. |
| 23,250 - 23,270 |
Critical Floor: Yesterday's intraday cash low (23,271.26). If broken, the index exposes a deeper slide toward the 23,000 structural support. |
Actionable Takeaway for Tomorrow's Morning Session
-
Expect a Muted/Weak Open: Do not chase gap-down opens blindly; wait for the first 15-30 minutes of cash session volume (09:30-10:00 HKT) to establish the morning range.
-
Watch 23,500: If HK50 immediately slips under 23,500, the path of least resistance will be a retest of the 23,350 - 23,370 shelf to test for local buying demand against US headwinds.
-
Bullish Reversal Prerequisite: Buyers must reclaim and hold above 23,540 - 23,560 on high volume to neutralize the drag from Wall Street's overnight weakness.
THE DAILY MARKET WRAP, IN YOUR INBOX BY 8 AM IST
One email, every trading morning. The moves that mattered, why they mattered, and what to watch next.