
Learn Candlestick Patterns: A Beginner's Guide Lesson 1&2
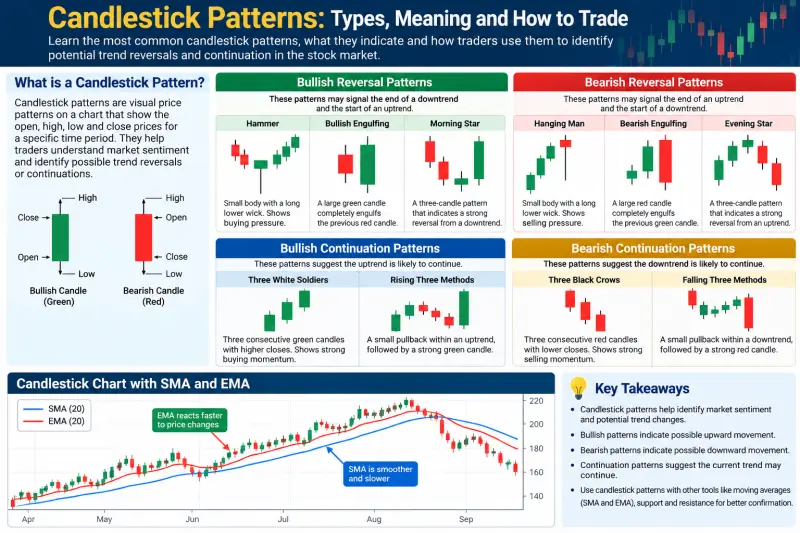
Candlestick patterns help you understand who is controlling the market - buyers or sellers - and whether the price might reverse or continue its current trend.
Lesson 1: Understand a single candlestick
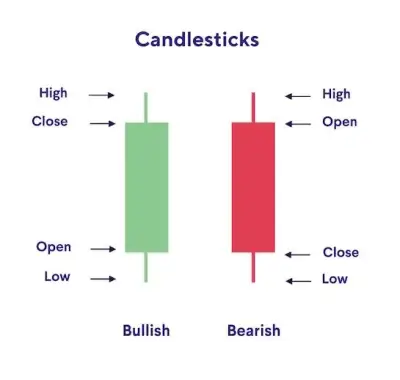
Every candlestick represents price movement over a specific period, such as 5 minutes, 15 minutes, 1 hour or 1 day.
Bullish candle - usually green-The closing price is higher than the opening price. Buyers pushed the price upward during that period.
Bearish candle - usually red -The closing price is lower than the opening price. Sellers pushed the price downward during that period.
The three important parts are:
-
Body: the area between the opening and closing prices.
-
Upper wick: shows how high the price went.
-
Lower wick: shows how low the price went.
Remember: a green candle does not automatically mean the next candle will rise, and a red candle does not guarantee the next candle will fall.
Lesson 2: The 6 candlestick patterns you should learn first
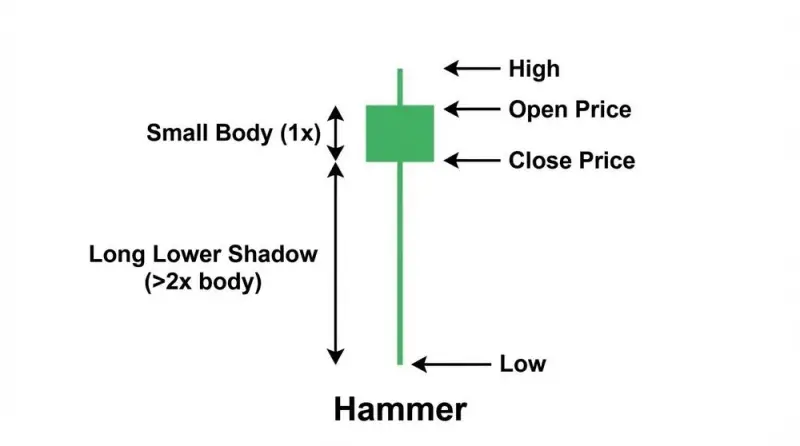
1.Hammer - potential bullish reversalA small body near the top with a long lower wick. After a decline, it may indicate that buyers are pushing back against sellers.
Look for: a downtrend followed by a hammer and confirmation from a bullish candle.
2. Bullish Engulfing - buyers gaining strength
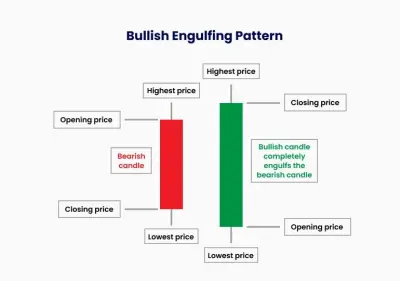
A large bullish candle whose body covers the previous bearish candle's body.Look for: this pattern near support or after a clear price decline.
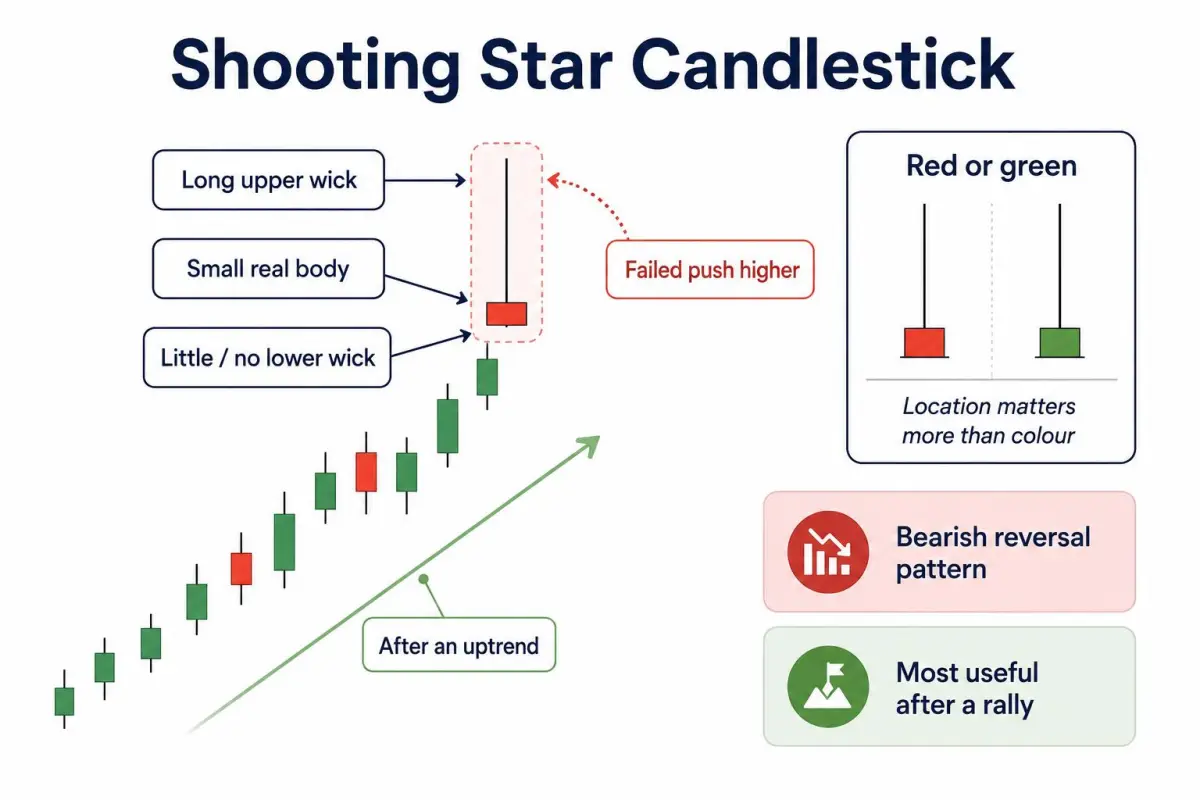
3. Shooting Star - potential bearish reversal
A small body near the bottom with a long upper wick. Buyers pushed the price higher, but sellers forced it back down.Look for: the pattern after an uptrend, preferably followed by a bearish candle.
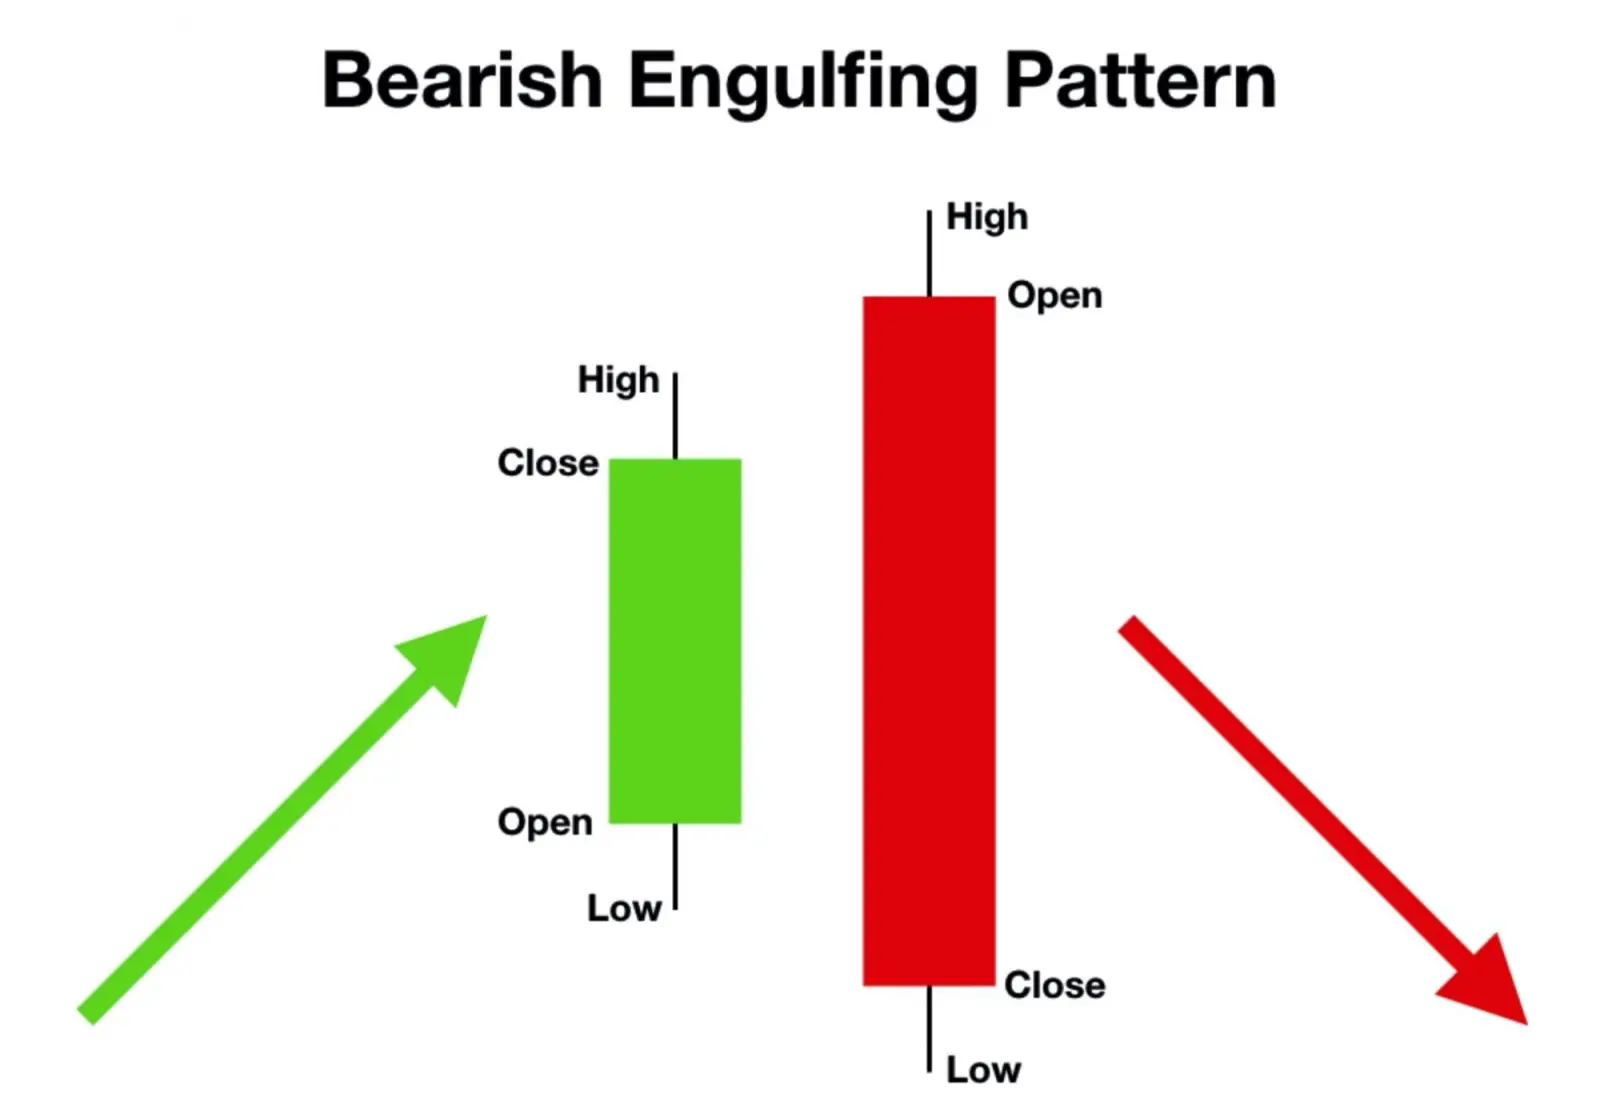
4. Bearish Engulfing - sellers gaining strength
A large bearish candle whose body covers the previous bullish candle's body.Look for: this pattern near resistance or after a strong price rise.
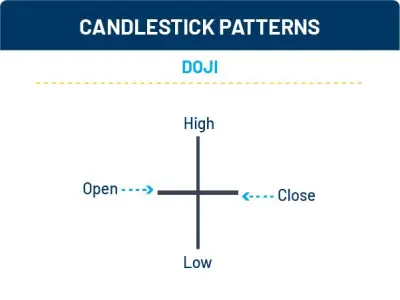
5. Doji - market indecision
The opening and closing prices are almost equal. Neither buyers nor sellers clearly dominated the candle's closing price.Look for: the surrounding trend and the next candle before deciding what it means.
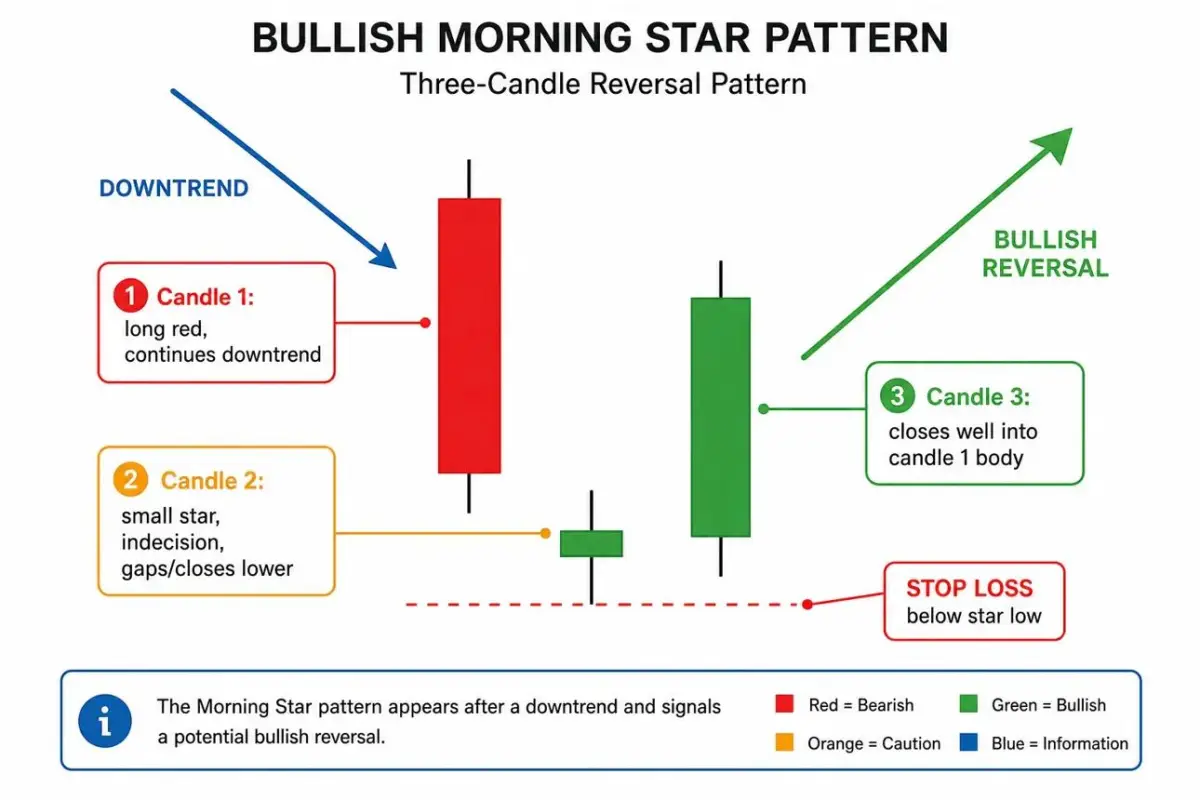
6. Morning Star - three-candle bullish reversal
A bearish candle, followed by a small-bodied candle, then a strong bullish candle.Look for: this sequence after a decline, with the third candle confirming renewed buying strength.
These are potential signals, not guarantees. The location of the pattern on the chart is just as important as its shape.

THE DAILY MARKET WRAP, IN YOUR INBOX BY 8 AM IST
One email, every trading morning. The moves that mattered, why they mattered, and what to watch next.