
SMA vs EMA: Key Differences Between Moving Averages
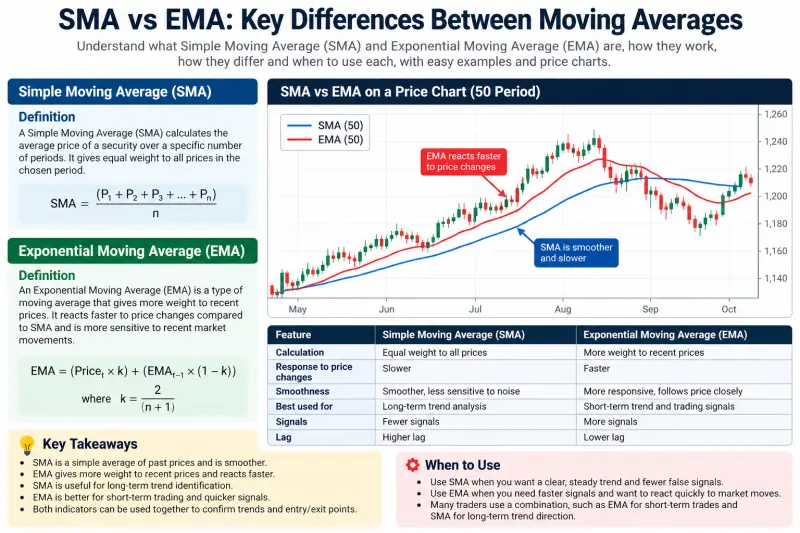
Simple Moving Average (SMA) and Exponential Moving Average (EMA) are popular technical indicators used to identify market trends. Learn how they work, their key differences, and how traders use them to analyse stock prices.
What Is a Simple Moving Average (SMA)?
A Simple Moving Average (SMA) is a technical indicator that calculates the average closing price of an asset over a specific number of periods. It gives equal importance to every price included in the calculation.
For example, a 10-day SMA adds the closing prices of the last 10 trading days and divides the total by 10. Traders use it to identify the overall market direction, support and resistance levels, and potential trend reversals.
Formula:
\[ SMA = \frac{\text{Sum of closing prices}}{\text{Number of periods}} \]
SMA moves smoothly on a price chart because it treats all prices in the selected period equally. However, it may respond more slowly when prices change suddenly.
What Is an Exponential Moving Average (EMA)?
An Exponential Moving Average (EMA) is a technical indicator that gives more weight to recent prices than older prices. This makes it more responsive to current market movements than the SMA.
Traders commonly use the 9-day, 12-day, 20-day and 50-day EMA to analyse short-term price trends and identify potential trading opportunities.
Formula:
\[ EMA_t=(P_t\times k)+(EMA_{t-1}\times(1-k)) \]
Here, \(P_t\) represents the current closing price, and \(k\) is the smoothing factor calculated as \(2/(n+1)\), where \(n\) is the number of periods.
Because recent prices receive greater weight, the EMA generally reacts faster to sudden price movements. However, this sensitivity can also produce more false trading signals in volatile markets.
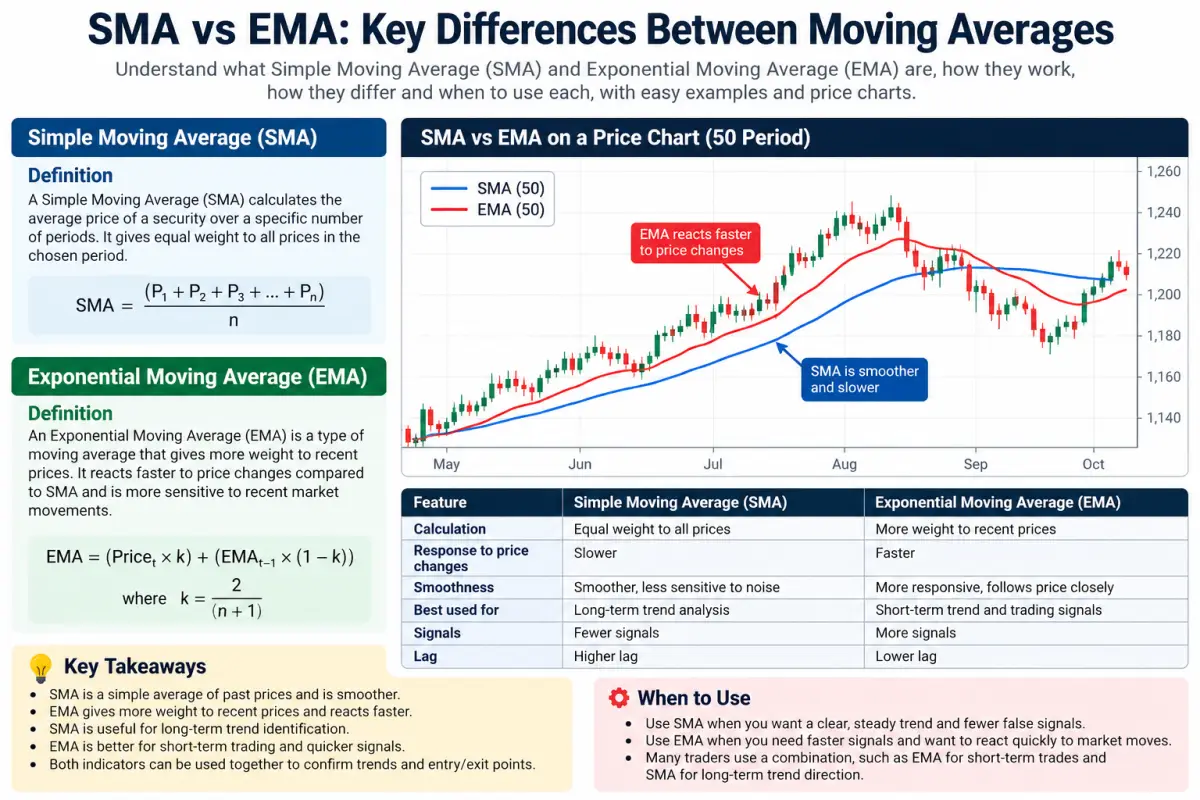
Key Differences Between SMA and EMA
|
Feature |
SMA |
EMA |
|---|---|---|
|
Calculation |
Equal weight to all prices |
More weight to recent prices |
|
Price response |
Slower |
Faster |
|
Chart appearance |
Generally smoother |
Follows price more closely |
|
Common use |
Longer-term trend analysis |
Short-term trend analysis |
|
Trading signals |
May appear later |
May appear earlier |
Which Moving Average Should Traders Use?
The choice depends on your trading strategy and timeframe. Long-term investors may prefer the SMA to understand the broader market direction, while short-term traders may choose the EMA to react more quickly to price changes.
Many traders combine both indicators. For example, they may use the 200-day SMA to assess the long-term trend and the 20-day EMA to identify shorter-term opportunities.
Conclusion: Neither indicator is always better. The SMA offers a smoother view of price trends, while the EMA responds more quickly to recent changes. Traders should combine these indicators with price action, volume and risk management rather than relying on moving averages alone.

THE DAILY MARKET WRAP, IN YOUR INBOX BY 8 AM IST
One email, every trading morning. The moves that mattered, why they mattered, and what to watch next.